The 1863 New York City Draft Riots—The Relative Worth of the Relief Supplied*
On July 13th, 1863, one hundred and sixty years ago, one of the more violent riots in New York City history took place. It began as a reaction to the draft (conscription into the Union Army) lottery that had started two days earlier.
While they are known as the New York City Draft Riots, much of the violence was directed at the black residents of the city. A particular target was male longshoremen and laborers who competed for jobs with Irish (and other) immigrants.[1] Women were not spared even though the vast majority of them were day workers or live-in servants of white families. While an official estimate of the number killed is 119, there are suggestions it could have been as high as 1,000. In addition to the many horrible murders and lynchings, there was also extensive property damage with thousands of homes pilfered, looted, and, in some cases, burned.
Relief Response
Today there are numerous public agencies and private charities that would respond quickly to such events. They did not exist in 1860. While at that time the Astors and Vanderbilts were very wealthy, they had not created the foundations that later would help address such calamities. However, within less than a week an organization titled A Merchant’s Committee for The Relief of Colored People Suffering from the Riots in the City Of New York was created. On July 23rd, one week after the end of the riot, this committee was distributing funds to hundreds of people. After a month, it had given relief to over 6,392 adults and their children.[2] A final report of the committee states that $42,600 was raised and after each individual was evaluated for their need, they received up to $5.00.[3]
What is the relative worth of this relief effort in today’s prices?
The common way used to compute relative worth is to use an inflation calculator to compute what is called the “Real Price” as did an author discussing this event a year ago.[4] The Real Price today of $42,600 in 1863 is $1,070,000. Given there were 6,392 adults, this is an average distribution of around $167 in today’s dollars.
The premise of MeasuringWorth is that there is never one answer to what is the relative worth of something, either today or in the past. The best measure depends on the context. In the broader sense we mean the worth of something is “the cost of the most valuable forgone alternative.” This alternative differs for the many participants in transactions. We will show how this applies to this event by presenting four different measures that the MeasuringWorth comparators give and why they are so different. We will then show that comparing the individual costs and earnings of those giving and receiving these funds tells a much richer story.
The Relative Values today of $42,600 and $5.00 in 1863.
Here are four different relative values in today’s dollars of the total amount of these funds raised 160 years ago and the maximum distribution.
| Amount in 1863. | $42,600 | $5.00 |
| The Real Price | $1,070,000 | $125.00 |
| The Relative Labor Earnings | $9,280,000 | $1,065.00 |
| The Relative Cost | $15,090,000 | $1,730.00 |
| The Economy Cost | $150,090,000 | $17,200.00 |
The Real Price compares the cost of a bundle of consumer goods such as food, clothing, and housing that $5.00 would have bought in 1863 to what a “similar” bundle would cost today as calculated by the increase in the Consumer Price Index (CPI). Needless to say, over 160 years the content of what the average household buys has changed significantly which is why we say the CPI is a very poor index for these kinds of comparisons.[5]
The Relative Labor Earnings computes how much a $5 distribution in 1863 would raise a family’s purchasing power today. We use the Unskilled Wage Index for this computation because that was what most of the recipients earned. This has grown significantly over 160 years because of increases in labor productivity. While $1,065 is not enough to repair a home that has burned, it might help pay rent while the home is repaired.
The Relative Cost inflates an amount in the past by how much per capita income has increased. Per capita income was $230 in 1863 and is $76,000 today. When the merchants subscribed $42,600 in 1863, that represented foregone expenditures on labor, inventories, investments and the like. A merchant who donated $100 to the fund was giving 43% of 1863’s per capita GDP. 43% of today’s per capita GDP is $33,000. The Relative Cost in today’s dollars of all the funds merchants contributed is over $15 million.
Finally, we present the Economy Cost of $150 million. This can be interpreted as the importance of the item to society as a whole. It is measured by calculating what was raised as a percent of 1863’s GDP and comparing that to today. New York was a city of a million people in 1860. If a city of a million today had its merchants make a similar response to a crisis, this measure says they would raise $150 million in one week.
Examples
While these three additional measures tell more than using just the CPI, there are many more comparisons that can be made which give a better understanding of the relative worth today of the 1863 relief payments. For example, we can compare the price, then and now, of specific purchases that a victim of the rioting might have made with a $5 relief payment. Below, we consider a few examples including staple food items and the wages of laborers in NYC.
Food: $125, or the CPI-adjusted value of $5 in 1863, would likely not get a family very far in most New York City grocery stores today. We might infer that $5 would not buy much food for a family in 1863. However, if we consider the relative market prices of grocery items, we see a different picture.
For example, back then the price of bacon was 6 cents per pound so $5.00 would have bought 88.33 pounds. At today’s prices, all that bacon would cost $528.33, over four times $125.
| Item | 1863 Price[6] | Amount $5 would buy | 2023 Price[7] | 2023 cost of 1863 amount |
| Bacon | $0.06 / lb | 83.33 lbs | $6.34 / lb | $528.33 |
| Coffee | $0.31 / lb | 16.13 lbs | $6.09 / lb | $98.22 |
| Butter | $0.17 / lb | 29.41 lbs | $4.55 / lb | $133.82 |
| Lard | $0.09 / lb | 55.56 lbs | $3.50 / lb | $194.44 |
| Cheese | $0.09 / lb | 55.56 lbs | $8.99 / lb | $499.44 |
| Cornmeal | $0.02 / lb | 250.00 lbs | $1.50 / lb | $375.00 |
| Flour | $0.03 / lb | 166.66 lbs | $0.57 / lb | $95.00 |
| Molasses | $0.33 / gal | 15.15 gals | $6.00 / gal | $90.91 |
| Almonds | $0.22 / lb | 22.73 lbs | $6.86 / lb | $155.91 |
| Whiskey | $0.44 / gal | 11.36 gals | $47.58 / gal | $540.68 |
| Gin | $3.25 / gal | 1.54 gals | $38.94 / gal | $59.91 |
| Rum | $2.50 / gal | 2.00 gals | $32.45 / gal | $64.90 |
Wage: What did the relief payment of $5.00 per family represent to the 2,450 men and 3,942 women who received this aid for their loses? The recipients of the aid were predominantly unskilled. Of the men, the occupations were 1,267 laborers and Longshoremen, 250 waiters, 177 Whitewashers, 176 drivers for cartmen, and 124 porters. For the women, it is 2,924 day’s work women, 664 servants hired by the month, 163 seamstresses and 106 cooks.
The reported laborers wage in New York in 1863 ranged from 25¢ to $1.75 a day. If we assume these workers were paid $1 a day, the maximum relief payment covers five days of work or 50 hours of work.
The current minimum wage in New York City is $15 an hour, so 50 hours at that pay is $750. ZipRecruiter reports that the average pay of a maid in the city today is $17.27 and that of a longshoreman is $18.89; both of which have benefited from labor productivity increases. Thus 50 hours of work at these rates are $863 and $944 respectively. These are not as much as the $1,065 Relative Labor Earnings reported above, but it is much more than the Real Price computation of $125.
Conclusions
Numbers and data like these will never be able to tell the full story of an event. We cannot possibly quantify the total physical impact of, and psychological trauma caused by, the 1863 Draft Riots, nor can we do so for the merchants’ response to aid suffering Black New Yorkers.
However, there are lots of numbers from the past which–– when carefully interpreted–– can help us to better understand a situation like the Draft Riots. Often, numbers such as the $42,600 raised by the Merchant’s committee are described by economists, journalists and others as having a “worth in today’s dollars” with a single (badly) inflated number. This quick and easy conversion is intended to give readers a way of relating to a dollar amount from an unfamiliar time period. Unfortunately, the quick answer given by CPI tends to give incomplete, or in some cases entirely wrong, comparisons to values from the past.
Using multiple relative values (Real Price, Relative Labor Earnings, Relative Cost, Economy Cost), and specific comparisons, you can tell a richer story than with Real Price alone. In the case of the 1863 Draft Riots, the four relative values we use each tell a very different story with additional specific examples of food and labor. Considering multiple perspectives on value is important as it informs the narratives we believe about the past, and, in this case, what we imagine to be possible when a local community comes together to help their neighbors in need.
* The author received research assistance from Ben Hogewood and editing by Lou Cain.
[1] “Near the docks, tensions that had been brewing since the mid-1850s between white longshoremen and black workers boiled over. As recently as March of 1863, white employers had hired blacks as longshoremen, with whom Irish men refused to work.” Harris, Leslie. In the Shadow of Slavery: African Americans in New York City 1626-1863 .
[2] “During the month ending August 21st there have been 3,942 women, and 2,450 men, making a total of 6,392 persons of mature age, relieved; full one-third being heads of families, whose children were included in the relief afforded by your committee, making a total of 12,782 persons relieved.” p. 9-10 of the Report.
[3] “If the person proves himself to be a worthy object of charity, he is furnished with a ticket which entitles him, on presenting the same to the Cashier, to receive a certain amount of money specified thereon. In no instance does the amount exceed $5, unless the Committee are satisfied upon evidence adduced, that the party is actually in need of more.” p. 9 of the Report.
[4] Mitchell, Elizabeth “The Real Story of the ‘Draft Riots’” New York Times, Feb. 18, 2021,
“… the shopkeepers quickly raised over $40,000, equivalent to more than $825,000 today.” Our number of $1,070,000 differs from Mitchell’s as she was writing in 2021. We use the most current CPI-inflated “real price” available, that is 2023; reflecting two more years of price inflation.
[5] See the essay “Defining Measures of Worth — Most are better than the CPI” where it is pointed out that food is 57% of the bundle in 1860 and is 13% today.
[6] New York Market – Prices of staple items, 1860-1863 (Missouri library guide). It should be noted that these items in 1863 are not necessarily identical to those in 2023.
https://babel.hathitrust.org/cgi/pt?id=mdp.39015076044463&view=1up&seq=379&size=125
[7] 2023 prices come from several sources including grocery store websites, price listings, NBER and FRED data. These prices represent a best estimate and may not coincide with the exact prices in all grocery stores.
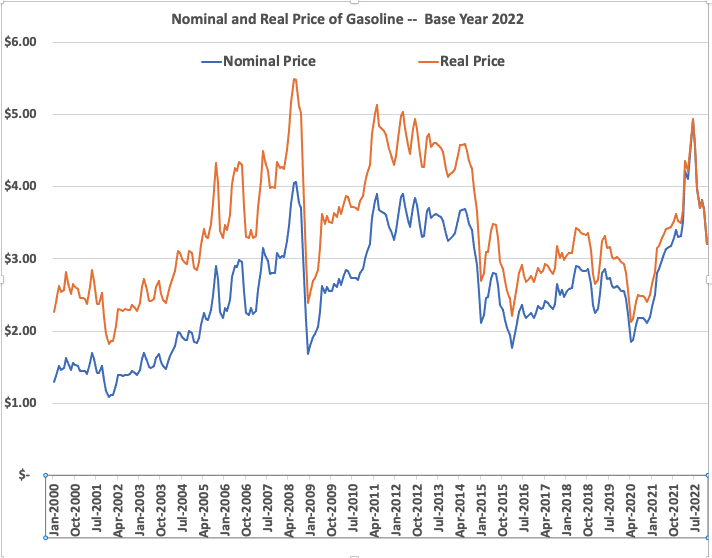
The Average Price of Gasoline for December 2022 is Lower than the Average Price for the 21st century.
Last April I blogged that “the average price of a gallon of gasoline reached $4.22 a gallon in the U.S. this past month, the highest nominal price ever and 16¢ higher than the previous record of $4.06 in July of 2008.” I then pointed out that the corrected for inflation using the CPI, that it was only 77% of the real price of gasoline in that month in 2008.
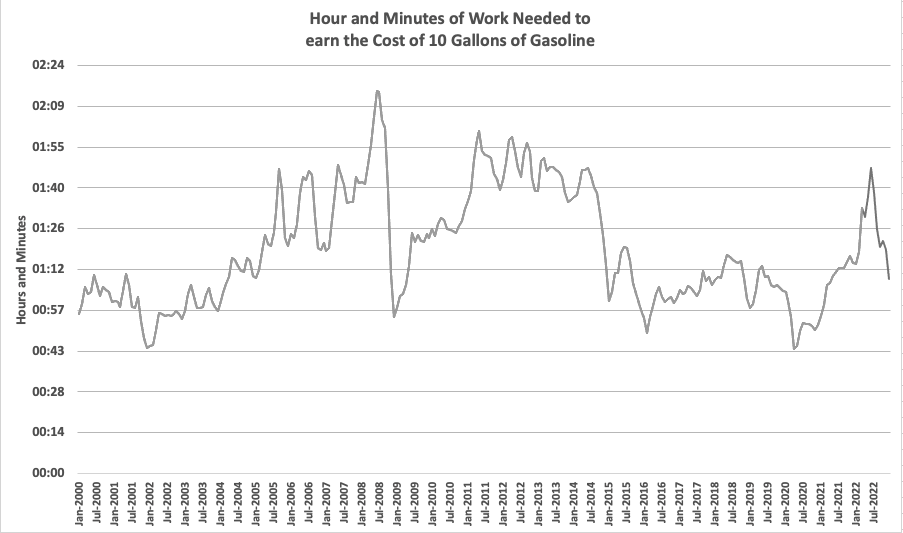
But from April to June the price continued to rise and reached its highest nominal level of the century of $4.93. But even this price in real terms is only 90% of the 2008 price and of the 277 months of the 21 century, the real price of gasoline in June this past year was only the 10th highest of them. Also, it was the 50th highest is hours of work needed to earn enough to buy a gallon of gasoline.
Where are we now? These days the “real price” of gasoline is about 5% below the average for this century. While the “work hours needed” is 13% below the average for this century.
The nominal price of gasoline in December 2022 of $3.21 was only larger than 77% of the monthly prices of the century. The lowest being $1.09 in December 2001 and the highest being $4.93 in June of 2022.
The real price of gasoline in December 2022 was larger than only 49% of the monthly real prices of the century. In current prices the lowest being $1.82 in December 2001 and the highest being $5.50 in June of 2008.
The “labor cost” of 10 gallons of gasoline in December 2022 was 1 hour and 8 minutes and was larger than only 39.5% of the monthly average times of the century. The lowest being 43 minutes in April 2020 and the highest being 2 hours and 14 minutes in June of 2008.
Inflation has dropped from 13% in May to .33% in December.
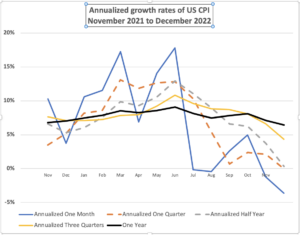
There is no reason we have to measure inflation from a year ago. By looking at the “annualized” inflation rates for the last month, the last three months, and the last six months it is negative or zero. For the last nine months it is 4.33% and for the last year 6.45%. The reasons it is higher for the longer periods is because of what was happening in the past, not now.
| Month | Year | Annualized One Month | Annualized One Quarter | Annualized Half Year | Annualized Three Quarters | One Year |
| Nov | 2021 | 10.29% | 3.50% | 6.61% | 7.64% | 6.81% |
| Dec | 2021 | 3.75% | 5.17% | 5.30% | 7.07% | 7.04% |
| Jan | 2022 | 10.58% | 8.16% | 6.06% | 7.10% | 7.48% |
| Feb | 2022 | 11.53% | 8.56% | 7.56% | 7.26% | 7.87% |
| Mar | 2022 | 17.25% | 13.08% | 9.85% | 7.83% | 8.54% |
| Apr | 2022 | 6.91% | 11.82% | 9.26% | 7.94% | 8.26% |
| May | 2022 | 14.06% | 12.66% | 10.59% | 9.23% | 8.58% |
| Jun | 2022 | 17.79% | 12.83% | 12.95% | 10.83% | 9.06% |
| Jul | 2022 | -0.14% | 10.29% | 11.05% | 9.60% | 8.13% |
| Aug | 2022 | -0.42% | 5.41% | 8.97% | 8.84% | 7.48% |
| Sep | 2022 | 2.61% | 0.67% | 6.58% | 8.70% | 7.81% |
| Oct | 2022 | 4.98% | 2.36% | 6.25% | 8.08% | 8.10% |
| Nov | 2022 | -1.21% | 2.10% | 3.74% | 6.63% | 7.11% |
| Dec | 2022 | -3.62% | -0.01% | 0.33% | 4.33% | 6.45% |
| Average | 6.74% | 6.90% | 7.51% | 7.93% | 7.77% |
The Annual Inflation Rate is not very Relevant.
60 Minutes Interview, September 18th, 2022
Scott Pelley: “Mr. President, as you know, last Tuesday the annual inflation rate came in at 8.3%.”
Article in the New York Times on Oct. 14, 2022 titled “September Inflation Report: Prices Rise Faster Than Expected, “Overall inflation was 8.2 percent over the year through September, according to the latest Consumer Price Index report on Thursday, a slight moderation from August but more than what economists had expected.”
Every month the Bureau of Labor Statistics (BLS) announces the cost of a bundle of goods and services the hypothetical “average household” bought during the previous month. As (in theory) the bundle remains constant over time, changes in the cost reflect changes in the prices of the goods and services. The number is called the Consumer Price Index or the CPI. While the BLS reports the series from 1913 to the present, the quality of the data is much better in the post-WWII period.
Inflation is defined as an increase in the CPI. The monthly announcement does create confusion as it includes both the percent change from the previous month and the 12-month change for the current month compared to the same month a year earlier.
Since June 16th, the FED has raised the Federal Funds rate by 0.75 basis points four times, one of the fastest increases ever. The headlines tell us there have been little impact on the inflation rate. The annual rate has declined less than 10% since June, from 9.06% to 8.20%.
But why is the 12-month rate change the relevant base? Why not a shorter base? The month-to-month changes can be volatile if a particular component has a large swing. The monthly increase in June this year was 1.37%, while in July there was a decrease of .01%. Both those swings can be explained by the rise and fall of energy prices. The annual index is not a good measure of trends. But why not use a quarter, half, or three quarters year change instead of the 12-month?
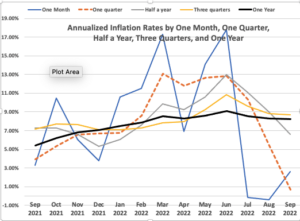
The chart shows 5 versions of inflation over the past year (September 2021 to September 2022), all converted to an annualized rate. The first one is the annualized amount of the one-month change. It is the most volatile. Then there are the annualized values for a one-quarter, half, three-quarters, and full year.
The lines tell different stories. The shorter series show a trend up from December to March, down two months and back up by June and then a decline. The black one year line shows very gradual movement up.
Here is a table of the values in the graph, however the first column of the one-month rate is not annualized.
| Month | Year | One Month percent change | Annualized One Quarter | Annualized Half Year | Annualized Three Quarters | One Year |
| Sep | 2021 | 0.27% | 3.90% | 7.25% | 7.14% | 5.39% |
| Oct | 2021 | 0.83% | 5.36% | 7.27% | 7.72% | 6.22% |
| Nov | 2021 | 0.49% | 6.56% | 6.61% | 7.64% | 6.81% |
| Dec | 2021 | 0.31% | 6.71% | 5.30% | 7.07% | 7.04% |
| Jan | 2022 | 0.84% | 6.76% | 6.06% | 7.10% | 7.48% |
| Feb | 2022 | 0.91% | 8.56% | 7.56% | 7.26% | 7.87% |
| Mar | 2022 | 1.34% | 13.08% | 9.85% | 7.83% | 8.54% |
| Apr | 2022 | 0.56% | 11.82% | 9.26% | 7.94% | 8.26% |
| May | 2022 | 1.10% | 12.66% | 10.59% | 9.23% | 8.58% |
| Jun | 2022 | 1.37% | 12.83% | 12.95% | 10.83% | 9.06% |
| Jul | 2022 | -0.01% | 10.29% | 11.05% | 9.60% | 8.52% |
| Aug | 2022 | -0.04% | 5.41% | 8.97% | 8.84% | 8.26% |
| Sep | 2022 | 0.22% | 0.67% | 6.58% | 8.70% | 8.20% |
| Average | 0.63% | 8.05% | 8.41% | 8.22% | 7.71% |
Note that by using the annualized three-month, one-quarter inflation rate, since June the rate has fallen 95% from 12.83% to 0.67%. The half-year index has a 50% drop; the three-quarter index has a 20% drop. The annualized rate has decreased by 9%. The base of comparison matters.
Conclusion.
Our current inflation is relatively mild by historical standards. According to the preferred one-quarter percentage change measure, it was only from March to July when the annualized rate was over 10%. Since July, inflation measured in this way has steadily declined. The annual index that is in the headline is very misleading . The length of time over which a comparison is being made counts.
The Ups and Downs of Gasoline Prices Revisited
In October I blogged “The ups and downs of gasoline prices this year has seen a 50% increase in gasoline prices over a year ago.” Is this a record increase? Are prices at an all-time high? The answer to both those questions was NO.”
Highest Price
Is it time to reconsider? The answer is IT DEPENDS (an answer economists like to use). According to the U.S. Energy Information Administration (eia.gov), the average price of a gallon of gasoline reached $4.22 a gallon in the U.S. this past month, the highest nominal price ever and 16¢ higher than the previous record of $4.06 in July of 2008. So YES, it is at an all-time (nominal) high.
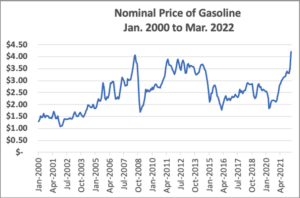
But most economists say that to compare prices over time, we need to convert this into the real price; that is, we need to adjust this nominal price for changes in the CPI.
In the second chart, we add the path of real prices to that of nominal prices, using the CPI (March 2022 base) to make the adjustment. When we do that, there were many months in which the real price was higher than in March 2022. For the 40 months from March 2011 to July 2014, 32 of them had a real price higher than $4.22. So, the answer is NO to it being an all-time high gasoline price if we correct for inflation.
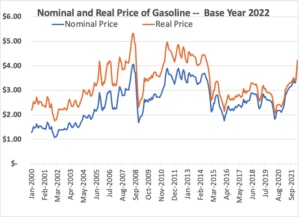
But this may seem like a sleight of hand. Gasoline prices are a part of the CPI. So, when gasoline prices go up, then won’t the CPI go up too? Yes, it does. The real price shows how gasoline’s price has changed relative to the price of everything else households buy. So, the $5.33 real price of a gallon of gasoline in June of 2008 means that, relative to everything else households bought that month, gasoline then was equivalent to a price of $5.33 today.[1]
“So What?” says a person watching the numbers on the gasoline pump go up and up. “I don’t care if you call it real price and tell me that it is not as expensive relatively, whatever that means. I am sure everything is more expensive now than it has ever been. Buying gasoline drains my paycheck faster than ever before.”
This is an understandable feeling; however, it is wrong. Deflating by the CPI is a legitimate way to see if an item has become relatively more or less expensive. However, it does not deal with the question of what an item is taking from our paychecks.
To answer that question, we present a third graph using a measure we feel is far more meaningful than correcting for the CPI. This graph shows the amount of time a person needs to work to earn enough to buy ten gallons of gasoline. We will call this the labor cost. In January 2000, the average hourly wage was $13.75[2] and the price of ten gallons of gas was $12.90. $12.90 divided by $13.75 is .938 and that multiplied by 60 minutes gives 56 minutes. Thus, it took a little less than an hour of work to earn enough to buy 10 gallons of gasoline. By the end of 2001, it was down to 44 minutes, but then by June of 2008 it was up to the highest value for this century so far –2 hours and 14 minutes.
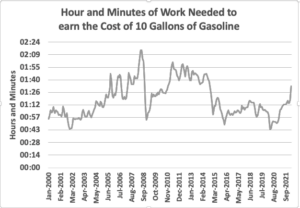
Today, the labor cost of 10 gallons is 1 hour and 33 minutes or 41 minutes less than the labor cost of a little over 13 and a half years earlier. The labor cost of gasoline in March of 2022 was 75% of what it was in June of 2008. For the 267 months since January 2000, 72 of them have a labor cost of gasoline greater than March 2022.
The Rate of Increase?
What about the question whether this is a record rate of increase? The answer is YES; this is the largest one-month percent increase of gasoline prices in the 21st century by all three measures: 20.0% nominal, 18.5% real, and 19.6% labor cost. But complaints about rising gasoline prices began before this past month. For the first quarter of 2022, the increases have been 27.7%, 23.8% and 26.2%, respectively. However, these are not record increases for a quarter. Five other three-month periods during this century had faster increases with the largest being the Spring of 2007 when it went up 38.1%.
Conclusions
The nominal price of gasoline reached an all-time high in March 2022 and appears to have declined slightly since. By two other measures, however, the March price increases were not records. In fact, the labor cost was higher in 27% of the other months of this century. The rate of increase this year has been rapid for understandable reasons. However, there have been periods of more rapid increase in the past.
In my opinion, some of the recent reactions to the gas price increase have been unnecessary. The economy can (and has) coped with higher gasoline prices measured in real terms or labor cost and if that will promote reduced consumption, the environment will benefit. Here is a link to the data used.
[1] If gasoline prices changed at the same rate as the CPI, then the real price would be constant.
[2] This number if from the BLS series titled “Average Hourly Earnings of Production and Nonsupervisory Employees, Total Private, Dollars per Hour, Monthly, Seasonally Adjusted” https://www.bls.gov/news.release/empsit.t24.htm
Bob Cratchit was NOT making less than the minimum wage.
Bob Cratchit was responsible for maintaining Scrooge’s account books, a job that involved much more than that of a simple bookkeeper today. His salary of 15 shillings a week made him poorly paid. Dickens chose that salary because he knew his readers would know this would be a low salary for such a position.
This salary, however, means he made more than the minimum wage. In today’s currency Cratchit’s annual wage would have a relative earnings value of £32,000 or $43,000. Today full-time work involves 2,000 hours per year (40 hours per week for 50 weeks). If we divide his computed annual relative earnings by 2,000 we find Cratchit’s hourly wage was £16 or $21.44.
The current minimum hourly wage in the United Kingdom is £ 8.91 or 55% of Cratchit’s hypothetical wage there. The current national minimum hourly wage in the United States is $7.25 or 34% of $21.44.
Thirty states, D.C., Guam and the USVI have a higher level. California at $13.00, Massachusetts at $13.50, Washington at $13.00, and the District of Columbia at $15.20 are the highest. None more that 70% of his calculated wage rate of $21.44.
What is the relative value of Bob Cratchit’s 15 shillings a week in 1843?
In Charles Dickens A Christmas Carol, Ebenezer Scrooge paid his clerk Bob Cratchit 15 shillings a week. What is the present-day equivalent of those 15 shillings? The MeasuringWorth comparator gives two answers.
In 2020, the real wage value of 15 shillings from 1843 is £75.28.
In 2020, the relative labour earnings value of 15 shillings from 1843 is £611.30
Why are they so different and what do they mean? The reason is that they are answers to two quite different questions. While they are both measured in British pounds, they should NOT be compared to each other.
The real wage is computed using a retail consumer price index of a basket of goods and services. In principle, by inflating the collection of goods (e.g., a goose) the average family could buy with 15 shillings, the index says that would be similar to a collection of goods an average family in today’s London could buy with £75.28. This is a totally unrealistic number!
Today a family of six could not afford the groceries to make a Christmas dinner for £75.28, let alone live for week. If we assume that Cratchit worked 10 hours a day for six days each week, that £75.28 rate would be £1.26 an hour. The current national minimum or living wage rate in the UK is £8.91 per hour. Even for workers under the age of 18 it is £4.60.
Price indexes do not reflect the actual increases in the cost of living over long periods of time because the market baskets purchased by representative consumers have changed so much. For example, food purchases constituted roughly 50% of the index in the 1840s; food is less than 10% today.* The Cratchits could not have purchased most of the goods in today’s basket because they didn’t exist in 1843.
The relative labour earnings is computed using an index of average earnings paid to workers. Thus, the “relative” wage of a worker who earned 15 shillings a week in 1843 is £611.30 today. At 52 weeks of work, that would correspond to about £32,000 a year. Bob Cratchit was responsible for maintaining Scrooge’s account books. The average UK accountant today earns a salary of £62,042 per year; the average bookkeeper, £26,848 per year. While Cratchit’s job may not have required a CPA, it involved much more than the tasks required of the average bookkeeper today. The fact Scrooge was paying Cratchit an amount slightly above that of an average bookkeeper speaks to Scrooge’s miserliness.
*The CPI and RPI are better designed to compute inflation rates than the “cost of living” over long periods on time.
The Ups and Downs of Gasoline Prices
The ups and downs of gasoline prices this year has seen a 50% increase in gasoline prices over a year ago.* Is this a record increase? Are prices at an all-time high? The answer to both those questions is NO.
The rapid increase has come from weather-created supply problems, OPEC and Russia agreeing to restrict their output, and that prices that were unusually low due to the COVID-caused dip in price last year where a gallon of regular gasoline fell from $2.90 in May of 2019 to $1.88 a year later. Comparing the current price of $3.36 with the pre-COVID price, the increase was 16% over two years, much less than the 50% of the past year. While the latest increase has been hard on the budget, it has not been unique, as the years of 2000, 2005 and 2010 all had one-year increases of over 55%.
This century started with the price around a $1.50 per gallon and for the next eight years it went up over 10% a year, mostly a result of the wars in Iraq and Afghanistan. It peaked with the highest average monthly price ever of $4.09 in June of 2008. That was just before the Great Recession; five months later it had dropped close to 60% to $1.69. I am sure no one wants us to have a recession now just to have lower gasoline prices. The longest period of high gasoline prices was from January 2011 to October 2014. During that 44-month period the average monthly price of gasoline was $3.55 and it never was less than $3.00.
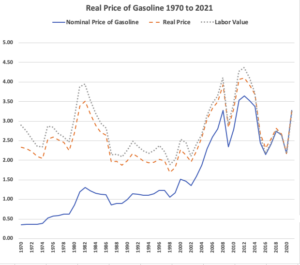
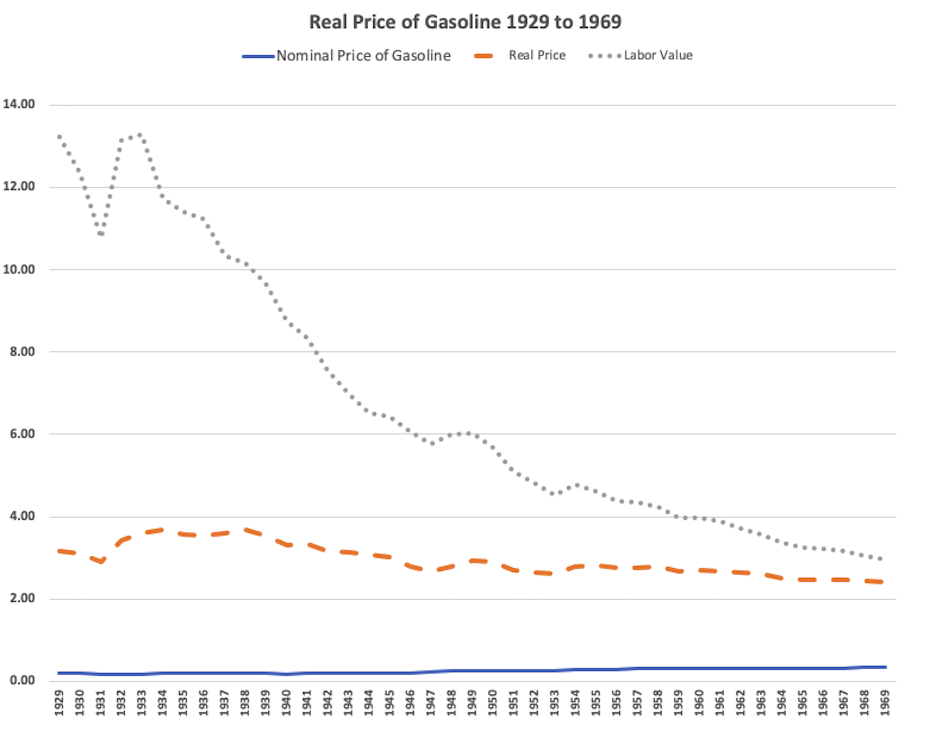
The more interesting questions are what are the real costs of filling up and how has that changed? In MeasuringWorth we have several different ways of describing a price of a commodity in the past. For this discussion I will use the real price that corrects for inflation and the labor value that holds constant the relative share of a worker’s pay it takes to buy the same amount of an item.
Correcting for inflation is what the standard inflation calculators do. The real price of gasoline in the past is more than today’s observed price because all prices have gone up, so we “correct” for how much gasoline costs compared to all the other things we are buying. For example, if gasoline cost $1.00 in 1990 and $3.00 today and at the same time food, clothing, rent and every else we buy also has gone up 300%, we would say the real price of the gasoline had not changed — the real price of gasoline in 1990 was $3.00 in today’s dollars. The real price, however, does not measure the “affordability” of gasoline. It does not compare that price to the income of those who are buying it.
The labor value measure shows what the price of gasoline would have to be today to take the same share of a worker’s pay as it did some year in the past. For example, if in the year 1990, the average price of gasoline was $1.00 and the hourly wage of a production worker was $10.00, a gallon cost 10.0% of an hour’s work. If today that wage index is $33.00, 10.0% of that is $3.30. So, the labor value of a gallon of gasoline in 1990 is $3.30 in today’s dollars.
Below are charts of the price of gasoline at the pump, its real price and its labor value. Notice that for this century, the real price and labor value have moved closely together. This reflects that real wages have not increased very much for the last 20 years.
The 40 years from 1929 to 1969 show a couple of interesting things. During the years of the Great Depression the real price was around $3.60 a gallon. Then during WWII with rationing and price controls it fell to $2.60 a gallon. For the next 20 years it remained relatively constant. At the end of the War, price controls and rationing ended and the price moved up to 27¢ in the next three years, then for the next 30 years it increased at a stable half-cent a year. For a short period, oil prices were driven by the politics of the Organization of Petroleum Exporting Countries (OPEC), but they did return to the long run trend. For the 25 years from 1975 to 2000, we can see the impact of the inflation of the 1970s as the real price and labor value compared to the nominal price are greater than before.
The more interesting number is the labor value. In 1933 the labor value of a gallon gasoline in today’s dollars was $ 13.28, the highest in all 92 years period. So, the next time you grumble about paying $50 for 15 gallons, think of your grandparent paying $200, four times as much with respect to what they earned.
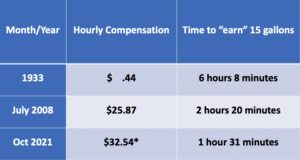
 * All prices in this article are of a gallon of regular gasoline as reported by U.S. Energy Information Administration who have published annual prices from 1929 to today.
“What the Tulsa Race Massacre Destroyed” — A lot more than what the New York Times says.
The New York Times (May 25, 2021) has published an article titled “What the Tulsa Race Massacre Destroyed.”* The article is a masterful presentation of graphics that give a wonderful feeling of what Greenwood, the prosperous black neighborhood in Tulsa, was like in May of 1921. The article started out saying “The Tulsa Race Massacre of 1921 killed hundreds of residents, burned more than 1,250 homes…” Three paragraphs later it states that on one destroyed block “there were four hotels, two newspapers, eight doctors, seven barbers, nine restaurants and a half-dozen professional offices of real estate agents, dentists and lawyers.” That was just one block among many destroyed. The story of the destruction of life and property in the first two days of June one hundred years ago is tragic and makes one want to think “if only this did not happen, what would the back community of Tulsa accomplished?”
The article has nine authors and three pages explaining their methodology. There are 20 different sources and 14 other people listed as assisting in the production. It was a big undertaking and very impressive.
So why can’t the New York Times learn how to measure relative worth? In the fifth paragraph of the article it says: “The financial toll of the massacre is evident in the $1.8 million in property loss claims — $27 million in today’s dollars —”
This number come from one many cost of living or purchase power calculators that one finds on the internet. Except for ours, they all use the CPI to inflate a value from the past and in most cases the answers are one dimensional and misleading. In this case, the error is spectacularly bad. A quick consideration of replacement costs shows this.
For example, 27 million divided by the 1,250 homes comes out to $20,000 a home and that does not take into account all the business lost. A simple search of google asking “what is the cost of building a new hotel?” gives the following answer: “The national average range is $13 million to $32 million with most people spending around $22. 1 million on a 3-star hotel with 100 rooms.” Restaurants and office buildings might cost from $250 to $500 a square foot to build. The article says that some half a dozen churches were burned, one of the was large brick Mount Zion Baptist Church, which one can imagine would take tens of $millions to re-build today. Remember that Greenwood not only lost buildings, but also water, sewer and power utilities.
The MeasuringWorth relative worth comparator, Purchase Power Today of US Dollars, gives seven choices for the relative worth of a financial amount in the past. They range from $21 million to $534 million and are measured using price, income, household expenditures and output indexes.
There is no doubt that the output measure should be used to measure the relative value of this $1.8 million in 1921. What the comparator shows is that in 1921 the share that $1.8 million was of the GDP is the same as the share $534.06 million is of GDP today. Another way to put it is to say if we spent over $0.5 billion on restoring the Greenwood neighborhood today, it would represent the same percent of the economy’s output that was destroyed a hundred years ago.
A second best choice for the relative worth would be to use the wage measure and that would say $1.8 million in 1921 has a relative wage of $149.14 million in wages today. This can be interpreted as saying it would take this much to hire as many workers today as the $1.8 million would have hired then.
This is not the first time the New York Times has used inflation calculators to come up with very bad estimates of relative worth. Part of the blame may be search engines that lead to calculators that “adjust for inflation” simply by using the CPI and lead users to believe there is one definitive answer. Unfortunately, lots of economists do the same.
Please do not use the comment box below. You can send me an email at sam@mswth.org if you wish.
- The New York Times may not allow you to connect from the link here. The address of the article is: https://www.nytimes.com/interactive/2021/05/24/us/tulsa-race-massacre.html
