
The ups and downs of gasoline prices this year has seen a 50% increase in gasoline prices over a year ago.* Is this a record increase? Are prices at an all-time high? The answer to both those questions is NO.
The rapid increase has come from weather-created supply problems, OPEC and Russia agreeing to restrict their output, and that prices that were unusually low due to the COVID-caused dip in price last year where a gallon of regular gasoline fell from $2.90 in May of 2019 to $1.88 a year later. Comparing the current price of $3.36 with the pre-COVID price, the increase was 16% over two years, much less than the 50% of the past year. While the latest increase has been hard on the budget, it has not been unique, as the years of 2000, 2005 and 2010 all had one-year increases of over 55%.
This century started with the price around a $1.50 per gallon and for the next eight years it went up over 10% a year, mostly a result of the wars in Iraq and Afghanistan. It peaked with the highest average monthly price ever of $4.09 in June of 2008. That was just before the Great Recession; five months later it had dropped close to 60% to $1.69. I am sure no one wants us to have a recession now just to have lower gasoline prices. The longest period of high gasoline prices was from January 2011 to October 2014. During that 44-month period the average monthly price of gasoline was $3.55 and it never was less than $3.00.
The more interesting questions are what are the real costs of filling up and how has that changed? In MeasuringWorth we have several different ways of describing a price of a commodity in the past. For this discussion I will use the real price that corrects for inflation and the labor value that holds constant the relative share of a worker’s pay it takes to buy the same amount of an item.
Correcting for inflation is what the standard inflation calculators do. The real price of gasoline in the past is more than today’s observed price because all prices have gone up, so we “correct” for how much gasoline costs compared to all the other things we are buying. For example, if gasoline cost $1.00 in 1990 and $3.00 today and at the same time food, clothing, rent and every else we buy also has gone up 300%, we would say the real price of the gasoline had not changed — the real price of gasoline in 1990 was $3.00 in today’s dollars. The real price, however, does not measure the “affordability” of gasoline. It does not compare that price to the income of those who are buying it.
The labor value measure shows what the price of gasoline would have to be today to take the same share of a worker’s pay as it did some year in the past. For example, if in the year 1990, the average price of gasoline was $1.00 and the hourly wage of a production worker was $10.00, a gallon cost 10.0% of an hour’s work. If today that wage index is $33.00, 10.0% of that is $3.30. So, the labor value of a gallon of gasoline in 1990 is $3.30 in today’s dollars.
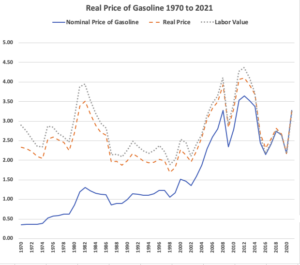
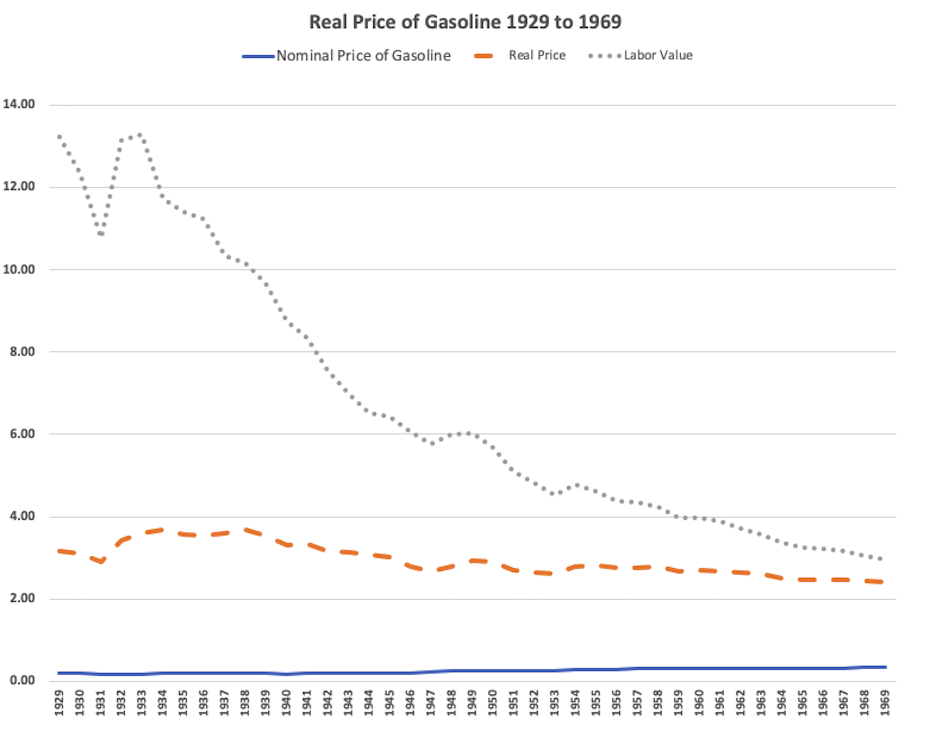
Below are charts of the price of gasoline at the pump, its real price and its labor value. Notice that for this century, the real price and labor value have moved closely together. This reflects that real wages have not increased very much for the last 20 years.
The 40 years from 1929 to 1969 show a couple of interesting things. During the years of the Great Depression the real price was around $3.60 a gallon. Then during WWII with rationing and price controls it fell to $2.60 a gallon. For the next 20 years it remained relatively constant. At the end of the War, price controls and rationing ended and the price moved up to 27¢ in the next three years, then for the next 30 years it increased at a stable half-cent a year. For a short period, oil prices were driven by the politics of the Organization of Petroleum Exporting Countries (OPEC), but they did return to the long run trend. For the 25 years from 1975 to 2000, we can see the impact of the inflation of the 1970s as the real price and labor value compared to the nominal price are greater than before.
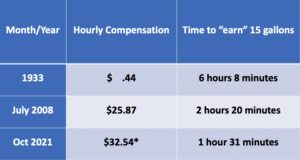
The more interesting number is the labor value. In 1933 the labor value of a gallon gasoline in today’s dollars was $ 13.28, the highest in all 92 years period. So, the next time you grumble about paying $50 for 15 gallons, think of your grandparent paying $200, four times as much with respect to what they earned.
 * All prices in this article are of a gallon of regular gasoline as reported by U.S. Energy Information Administration who have published annual prices from 1929 to today.