
60 Minutes Interview, September 18th, 2022
Scott Pelley: “Mr. President, as you know, last Tuesday the annual inflation rate came in at 8.3%.”
Article in the New York Times on Oct. 14, 2022 titled “September Inflation Report: Prices Rise Faster Than Expected, “Overall inflation was 8.2 percent over the year through September, according to the latest Consumer Price Index report on Thursday, a slight moderation from August but more than what economists had expected.”
Every month the Bureau of Labor Statistics (BLS) announces the cost of a bundle of goods and services the hypothetical “average household” bought during the previous month. As (in theory) the bundle remains constant over time, changes in the cost reflect changes in the prices of the goods and services. The number is called the Consumer Price Index or the CPI. While the BLS reports the series from 1913 to the present, the quality of the data is much better in the post-WWII period.
Inflation is defined as an increase in the CPI. The monthly announcement does create confusion as it includes both the percent change from the previous month and the 12-month change for the current month compared to the same month a year earlier.
Since June 16th, the FED has raised the Federal Funds rate by 0.75 basis points four times, one of the fastest increases ever. The headlines tell us there have been little impact on the inflation rate. The annual rate has declined less than 10% since June, from 9.06% to 8.20%.
But why is the 12-month rate change the relevant base? Why not a shorter base? The month-to-month changes can be volatile if a particular component has a large swing. The monthly increase in June this year was 1.37%, while in July there was a decrease of .01%. Both those swings can be explained by the rise and fall of energy prices. The annual index is not a good measure of trends. But why not use a quarter, half, or three quarters year change instead of the 12-month?
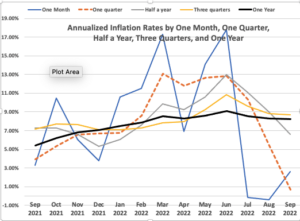
The chart shows 5 versions of inflation over the past year (September 2021 to September 2022), all converted to an annualized rate. The first one is the annualized amount of the one-month change. It is the most volatile. Then there are the annualized values for a one-quarter, half, three-quarters, and full year.
The lines tell different stories. The shorter series show a trend up from December to March, down two months and back up by June and then a decline. The black one year line shows very gradual movement up.
Here is a table of the values in the graph, however the first column of the one-month rate is not annualized.
| Month | Year | One Month percent change | Annualized One Quarter | Annualized Half Year | Annualized Three Quarters | One Year |
| Sep | 2021 | 0.27% | 3.90% | 7.25% | 7.14% | 5.39% |
| Oct | 2021 | 0.83% | 5.36% | 7.27% | 7.72% | 6.22% |
| Nov | 2021 | 0.49% | 6.56% | 6.61% | 7.64% | 6.81% |
| Dec | 2021 | 0.31% | 6.71% | 5.30% | 7.07% | 7.04% |
| Jan | 2022 | 0.84% | 6.76% | 6.06% | 7.10% | 7.48% |
| Feb | 2022 | 0.91% | 8.56% | 7.56% | 7.26% | 7.87% |
| Mar | 2022 | 1.34% | 13.08% | 9.85% | 7.83% | 8.54% |
| Apr | 2022 | 0.56% | 11.82% | 9.26% | 7.94% | 8.26% |
| May | 2022 | 1.10% | 12.66% | 10.59% | 9.23% | 8.58% |
| Jun | 2022 | 1.37% | 12.83% | 12.95% | 10.83% | 9.06% |
| Jul | 2022 | -0.01% | 10.29% | 11.05% | 9.60% | 8.52% |
| Aug | 2022 | -0.04% | 5.41% | 8.97% | 8.84% | 8.26% |
| Sep | 2022 | 0.22% | 0.67% | 6.58% | 8.70% | 8.20% |
| Average | 0.63% | 8.05% | 8.41% | 8.22% | 7.71% |
Note that by using the annualized three-month, one-quarter inflation rate, since June the rate has fallen 95% from 12.83% to 0.67%. The half-year index has a 50% drop; the three-quarter index has a 20% drop. The annualized rate has decreased by 9%. The base of comparison matters.
Conclusion.
Our current inflation is relatively mild by historical standards. According to the preferred one-quarter percentage change measure, it was only from March to July when the annualized rate was over 10%. Since July, inflation measured in this way has steadily declined. The annual index that is in the headline is very misleading . The length of time over which a comparison is being made counts.