Tutorial 2: How to Compare Money Values from Different Years
Joanna Short, Augustana College
Another common reason for using the Measuring Worth calculators is to compare money values from different years. Take for example the wages paid by Ford Motor Company. In addition to his innovations in automobile production, Henry Ford also radically changed worker compensation. In 1914, Ford announced he would pay workers meeting certain conditions five dollars per day, more than doubling the wages for most of his workers. Simultaneously, the work day was reduced from nine hours to eight hours.
Why did Ford increase pay dramatically? It does not appear that prior to the five-dollar-day, Ford workers were underpaid relative to the standard for production work at that time. A quick check of the Wage-U.S. series shows that production workers were paid an average of $0.20 per hour in 1913. At $2.34 per day ($0.26 per hour) in 1913, Ford was already paying good wages. Apparently, the pay increase was a shrewd response to the high labor turnover at Ford, as workers there suffered from the more monotonous and fast-paced nature of assembly line work (see Raff and Summers, 1987).
 Was Ford able to maintain his wage advantage over time? Ford wages fell briefly to $4 per day in 1932 before increasing steadily to $6 per day in 1935 (Harvard Business School, Lehman Brothers Collection) and $21.34 per day in 1955 (Nevins and Hill). Let’s compare the wages of three generations of Ford workers. Suppose a father, son, and grandson all work at Ford; beginning in 1914, 1935, and 1955, respectively. Since we generally think of wages in hourly or annual terms, the starting hourly earnings of the three generations are summarized below:
| Generation | Year | Wage (per day) | Hourly | Annual |
|---|---|---|---|---|
| Father | 1914 | $5 | $0.625 | $1250 |
| Son | 1935 | $6 | $0.75 | $1500 |
| Grandson | 1955 | $21.34 | $2.66 | $5335 |
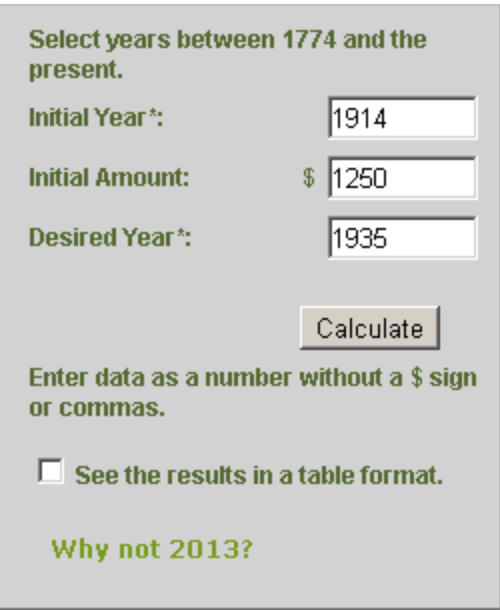
How did the son’s starting wage compare to the father’s? Let’s adjust the father’s wages for the general inflation between 1914 and 1935. We can use the Relative Values-US$ comparator to see how much $1250 per year would be worth in 1935 (see screenshot below). We are offered several possible answers. These answers vary according to the specific question we are asking about Ford wages. For more information on which answer we are looking for, please see Tutorial 4, or Explaining the Measures of Worth. Using the traditional method of adjusting by the growth in the CPI, we see that $1250 would be worth $1770 in 1935, considerably more than the son’s earnings of $1500. In real terms, the father earned about 18% more than the son. Notice, that in the computation above, we converted a 1914 dollar value to 1935 dollars, so we could compare the two. We could just as easily convert the 1935 value into what that would have been worth in 1914 dollars. In other words, we could start with the son’s starting wage of $1500 per year, take out the inflation that had occurred since 1914, and compare the result to the father’s wage of $1250 per year. Again, using the Relative Values-US$ comparator, $1500 is worth $1060 in 1914 dollars. When compared with the father’s $1250 per year, we again see that the father earned about 18% more than the son. Note, however, that although the purchasing power of Ford wages declined over time, Ford still appears to be a generous employer in 1935. According to the wage series, the average production worker wage in 1935 was $0.54 per hour. At $0.75 per hour, the son earned more than many of his contemporaries; however, not as much more as his father did.
How about the grandson’s earnings relative to the son? By now, you should be able to confirm that the son’s earnings of $1500 per year are worth $2930 (again, deflating by the CPI) in 1955 dollars. Thus, the grandson’s $5335 per year was considerably more than the son’s earnings.
More Practice Examples:
- How much did the grandson, from the example above, earn in 1935 dollars? Who earned the most in 1935 dollars—father, son, or grandson?
- Which cost more, or was worth more, in real (2017) terms?
- The construction of Fenway Park: $650,000 in 1912
The reconstruction of Yankee Stadium: $1.5 billion in 2009 - The federal minimum wage in 1938: $0.25 per hour
The federal minimum wage in 2017: $7.25 per hour - The president’s salary in 1969: $200,000
The president’s salary in 2002: $400,000 - The prime minister’s salary in 1937: £10,000
The prime minister’s salary in 1982: £38,200
The prime minister’s salary in 2010: £150,000
- The construction of Fenway Park: $650,000 in 1912
Solutions:
- Using the CPI (the real wage), the grandson’s wage is worth $2740 in 1935. Thus, the grandson earned considerably more than the father ($1770) or the son ($1500) in 1935 dollars.
- Use the relative values calculator’s results for a “project” for part a. For the rest, use the results for an “income or wealth.” Also, for part d, use the Relative values- UK £ calculator, for 2011.
- The Yankee Stadium reconstruction cost much more: $1.55 bill-$1.69 bill (vs. $11.3 mill-$280 mill)
- For all measures except the real wage ($4.35), the minimum wage in 1938 ($9.44-$55.50) was worth more than the minimum wage in 2017 ($7.25)
- The president earned more, in real terms, in 1969: $1.25 mill - $3.19 mill (vs. $498,000-$592,000)
- The prime minister earned the most, in real terms, in 1937: ( £529,500-£2,827,000)
Next most in 2010: (£153,700 - £155,100) or 1982: (£110,600-£205,000)