Tutorial 3: How to Convert Nominal GDP to Real GDP
Joanna Short, Augustana College
In order to see a recession or recovery in the overall economy, we must look at real GDP. GDP is a measure of the total value of all goods and services produced within a country in one year. We say that we have “nominal” GDP when the value is calculated at current-year prices. For example, for the years 1990 to 1992 U.S. nominal GDP is (bea.gov):
| U.S. nominal GDP | |
|---|---|
| 1990 | $5,979.6 bill |
| 1991 | 6,174.0 bill |
| 1992 | 6,539.3 bill |

It looks like U.S. production was increasing over time. However, did GDP increase because production was rising, or because prices were rising? It is possible, for example, that production remained constant over the three years, and all we’re seeing is the effects of inflation. Here’s where we need to convert nominal GDP to real GDP. Real GDP takes out the effects of inflation over time, in the same way that we have adjusted the price of a Model T and box office receipts. Economists use the GDP deflator to make this conversion. The GDP deflator is a price index, like the CPI, but it includes goods and services bought by firms and government, in addition to consumer goods. Since GDP includes all of these goods, we should use the GDP deflator. The data series GDP-US provides these calculations for us. The results are given below:

Notice that real GDP is reported in millions of 2009 dollars. This means that nominal GDP has been converted to what it would have been in each year, had prices (as measured by the GDP deflator) been the same as in 2009. Now, by examining real GDP over time, we can see that production fell between 1990 and 1991. There was a brief recession, then a recovery in 1992.
More Practice:
- Find nominal GDP and real GDP for the U.S. from 2007 to 2010.
- What was the annual growth rate for nominal GDP:
- from 2007 to 2008?
- from 2008 to 2009?
- from 2009 to 2010?
- What was the annual growth rate for real GDP:
- from 2007 to 2008?
- from 2008 to 2009?
- from 2009 to 2010?
Solutions:
- Using the data series GDP-US, you should obtain the following table:
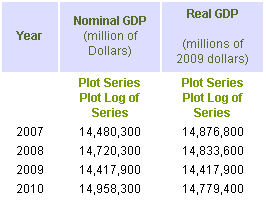
-
Using the Annualized Growth Rates comparator, you should obtain:
- 1.66%
- -2.05%
- 3.75%
-
- -0.29%
- -2.80%
- 2.51%